Project Overview
This project builds on previous data extraction tasks to analyze and visualize performance data. Key outputs include an empirical probability distribution and a second visualization (e.g., scatter plot or time series) to explore variable relationships.
Key Tasks
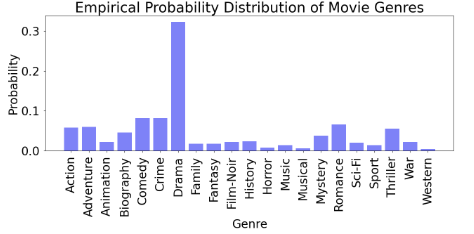
- Empirical Probability Distribution: Created a histogram to study data distribution.
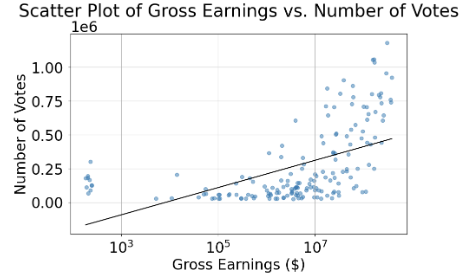
- Additional Visualization: Generated a scatter plot/time series for comparative analysis.
- Descriptive Analysis: Calculated average, variance, and functional form of the distribution.
Tools Used
- Python
- Pandas
- Matplotlib
- Jupyter Notebook
View the Code
Access the Jupyter Notebook and full implementation for this project on GitHub:
View on GitHub